Note
Go to the end to download the full example code.
Random Surface Points#
If only random point locations are desired, then instead of
pyransame.random_surface_dataset(), pyransame.random_surface_points()
can be used. Compare this example to Random Surface Sampling.
import pyvista as pv
from pyvista import examples

import pyransame

antarctica = examples.download_antarctica_velocity()
The units of this mesh are in meters, which causes plotting issues over an entire continent. So the units are first converted to kilometers.
antarctica.points /= 1000.0 # convert to kilometers
sample 500 points uniformly randomly.
points = antarctica.ransame.surface_points(500)
points
array([[  455.53977704, -1738.89050084,     0.        ],
       [  607.56121736, -1869.38671724,     0.        ],
       [  800.0025603 , -2022.07958632,     0.        ],
       ...,
       [   26.27171653,  2178.00299737,     0.        ],
       [  391.91205851,  1818.37675838,     0.        ],
       [  556.77570934,  1929.03072898,     0.        ]], shape=(500, 3))
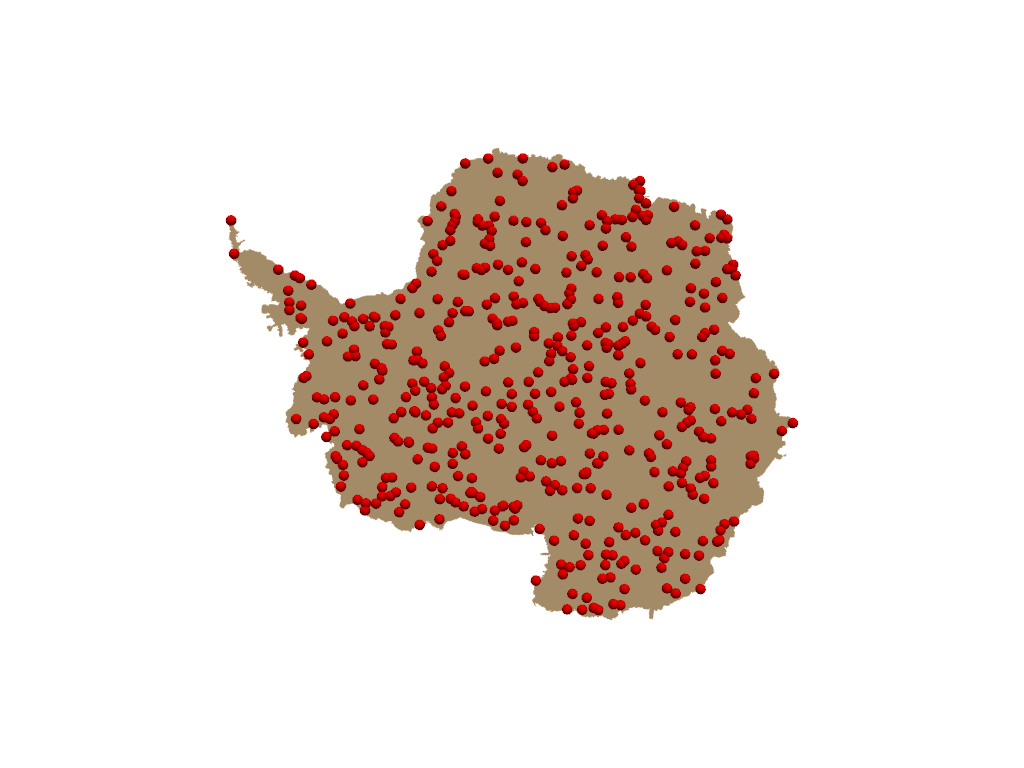
pyransame.random_surface_points() returns a numpy.ndarray object
containing 500 point locations without any sampled data. To plot as spheres,
we first create a pyvista.PolyData object. Since we did not sample any
data from antarctica, we do not have any scalar data, so color the
spheres red.
pl = pv.Plotter()
pl.add_mesh(antarctica, color="tan")
spheres = pv.PolyData(points).glyph(
    geom=pv.Sphere(radius=50), scale=False, orient=False
)
pl.add_mesh(spheres, color="red")
pl.view_xy()
pl.show()
Total running time of the script: (0 minutes 1.219 seconds)