Note
Go to the end to download the full example code.
Random Surface Sampling#
Random points on a dataset of antarctica are sampled uniformly within the area of the mesh.
import numpy as np
import pyvista as pv
from pyvista import examples

import pyransame

antarctica = examples.download_antarctica_velocity()
The units of this mesh are in meters, which causes plotting issues over an entire continent. So the units are first converted to kilometers.
antarctica.points /= 1000.0 # convert to kilometers
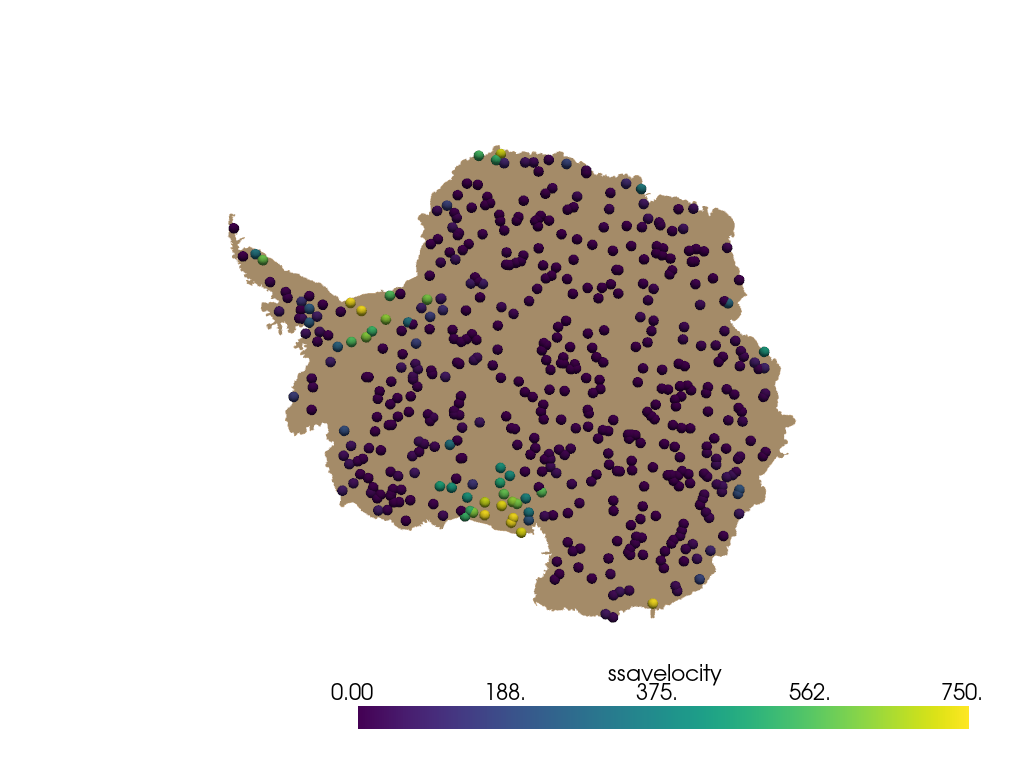
sample 500 points uniformly randomly.
points = antarctica.ransame.surface_dataset(500)
points
The ransame accessor on the dataset (registered by pyransame)
forwards to pyransame.random_surface_dataset(), which returns a
pyvista.PolyData object
containing 500 points (and 500 corresponding vertex cells). The cell and
point data is also sampled onto points. Each randomly sampled point is
plotted as a sphere with radius 50 km and colored by ssavelocity.
pl = pv.Plotter()
pl.add_mesh(antarctica, color="tan")
spheres = points.glyph(geom=pv.Sphere(radius=50), scale=False, orient=False)
pl.add_mesh(spheres, scalars="ssavelocity", clim=[0, 750])
pl.view_xy()
pl.show()
Comparison to sampling mesh points#
A different approach to sampling is to select random mesh points that define the topology of the mesh. This approach does not lead to effective uniform sampling of mesh area (or length/volume as applicable), which will be demonstrated in this example. The area of each cell is stored first, which will be useful for explaining the later results.
antarctica = antarctica.compute_cell_sizes()
Sample 500 random vertices that define the cells.
vertices = np.random.default_rng().choice(antarctica.points, 500)
Plot the mesh colored by area of each cell. Plot the location of each point. Note that these points do not have sampled data in this case, so color them red.
pl = pv.Plotter()
pl.add_mesh(antarctica, scalars="Area")
spheres = pv.wrap(vertices).glyph(geom=pv.Sphere(radius=50), scale=False, orient=False)
pl.add_mesh(spheres, color="red")
pl.view_xy()
pl.show()
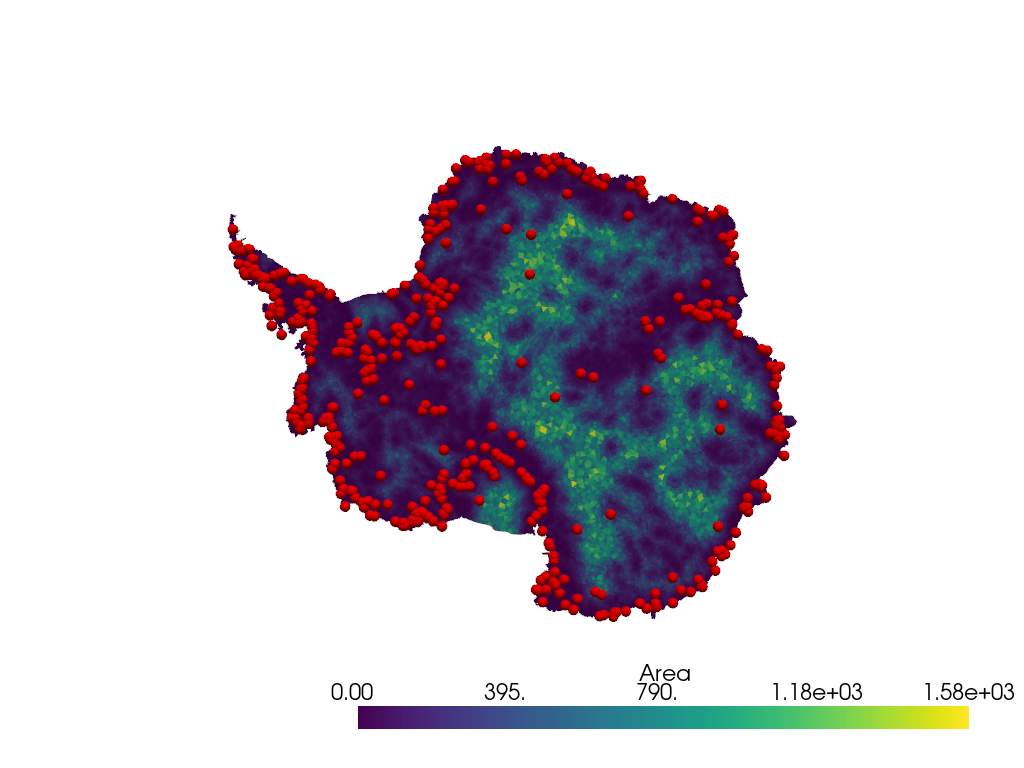
The sampled points are not uniformly sampled on the area of the mesh. The
points are clustered in regions that have small cell sizes, i.e. there is
a higher density of mesh points that define the cells. pyransame
does not use this approach and instead samples the space uniformly randomly
with respect to the area of the mesh.
Total running time of the script: (0 minutes 6.214 seconds)