Note
Go to the end to download the full example code.
Weighted Random Surface Sampling#
Sampling can be weighted on the mesh. Compare to Random Surface Sampling.
import pyvista as pv
from pyvista import examples

import pyransame

antarctica = examples.download_antarctica_velocity()
The units of this mesh are in meters, which causes plotting issues over an entire continent. So the units are first converted to kilometers.
antarctica.points /= 1000.0 # convert to kilometers
The random sampling occurs over the area of the mesh, i.e. inside the cells.
So cell data is needed for weighting. Here, pyvista.cell_centers is used
to get position of the cells relative to the top of the mesh.
pyvista.DataSetFilters.point_data_to_cell_data filter can be used to convert
point data to the needed cell data if required.
ymax = antarctica.bounds[3]
weights = (ymax - antarctica.cell_centers().points[:, 1]) ** 2
Do weighted sampling.
points = pyransame.random_surface_dataset(antarctica, 500, weights=weights)
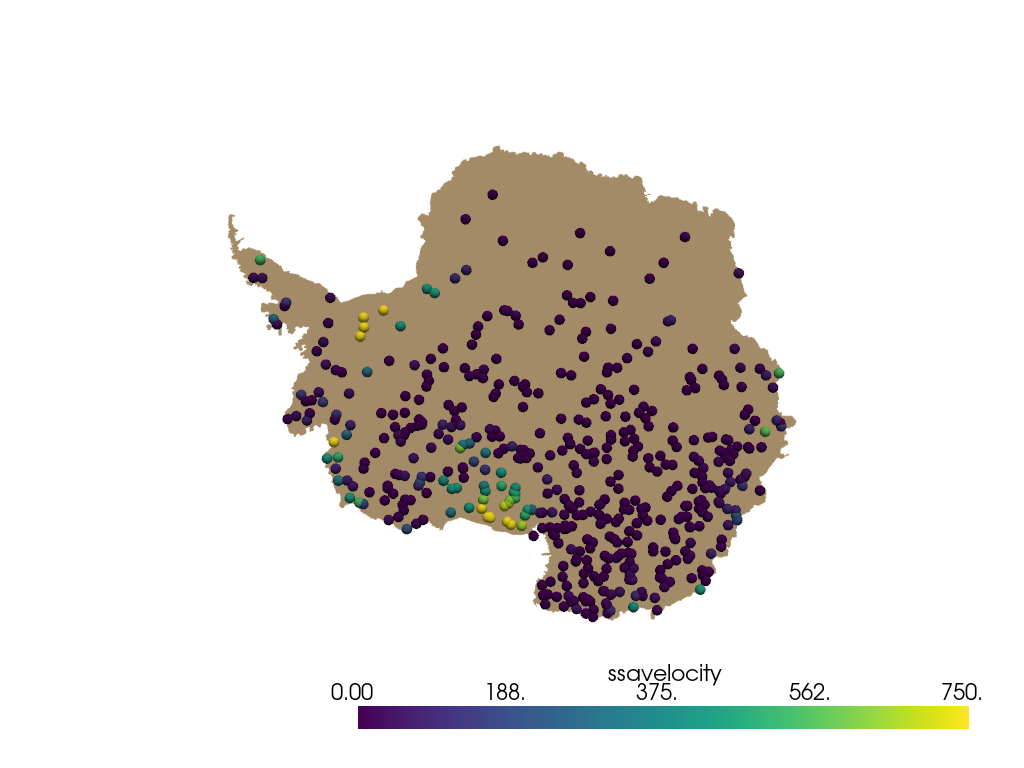
Now plot result.
pl = pv.Plotter()
pl.add_mesh(antarctica, color="tan")
spheres = pv.wrap(points).glyph(geom=pv.Sphere(radius=50), scale=False, orient=False)
pl.add_mesh(spheres, scalars="ssavelocity", clim=[0, 750])
pl.view_xy()
pl.show()

The same thing can be done with cell data on the mesh.
antarctica.cell_data["weights"] = weights
points = pyransame.random_surface_dataset(antarctica, 500, weights="weights")
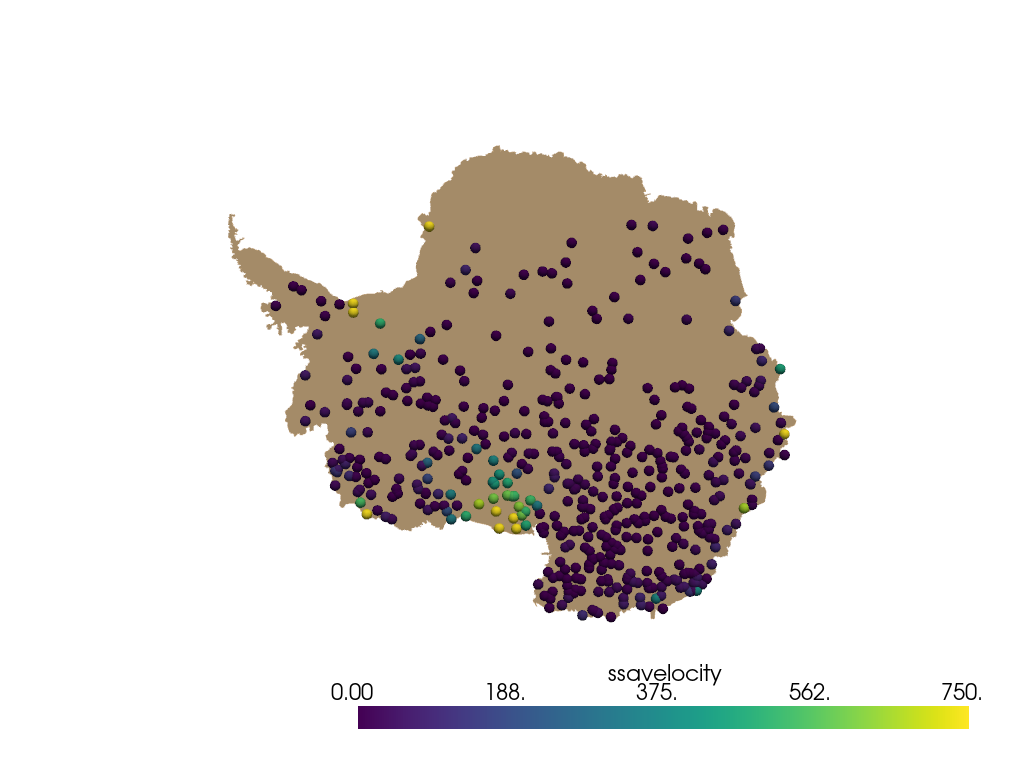
Now plot result. The result will be slightly different due to random nature of the sampling.
pl = pv.Plotter()
pl.add_mesh(antarctica, color="tan")
spheres = pv.wrap(points).glyph(geom=pv.Sphere(radius=50), scale=False, orient=False)
pl.add_mesh(spheres, scalars="ssavelocity", clim=[0, 750])
pl.view_xy()
pl.show()

Total running time of the script: (0 minutes 17.374 seconds)